
This week, a 4.5 billion year old #meteorite that glows eerily under light, evolution of the world’s alphabets in one cool #infographic, fudgy, chewy #chocolate brownies, honest global brand slogans, different kinds of #futurism and much more #ContentCatnip #InterestingThings
Tag Archives: infographic
10 Interesting Things I Found on the Internet #150

This week: 90’s Grrl #Grunge, #cat goddess #Bastet, 8 factors for #happiness in one helpful #infographic, mythical #beasts of #Scandinavia, #soups and stews from around the world and much more. #ContentCatnip #InterestingThings Chasing away winter in Slovenia with a 1000 year old Pagan tradition Throwing Muses enjoying coffee together in a diner, some time inContinue reading “10 Interesting Things I Found on the Internet #150”
10 Interesting Things I Found on the Internet #107

Haere mai and welcome to edition #107 of the ever-lasting gobstopper that is 10 Interesthing Things I Found on the Internet just when you thought all weird things have been exhausted…here comes a few more to tickle your fancy and light up your nether-regions. Let me know what you think below in the comments…Ciao for now.
10 Interesting Things I Found on the Internet #94

Watch a cosy French family film about a boy and a wild horse, learn how to make an easy wild mushroom pasta, how to enjoy rituals in your relationship and some psychedelic AI art in the style of Codex Seraphinianus and much more in edition #94 of Interesting Things
The Anatomy of Fantastical Creatures
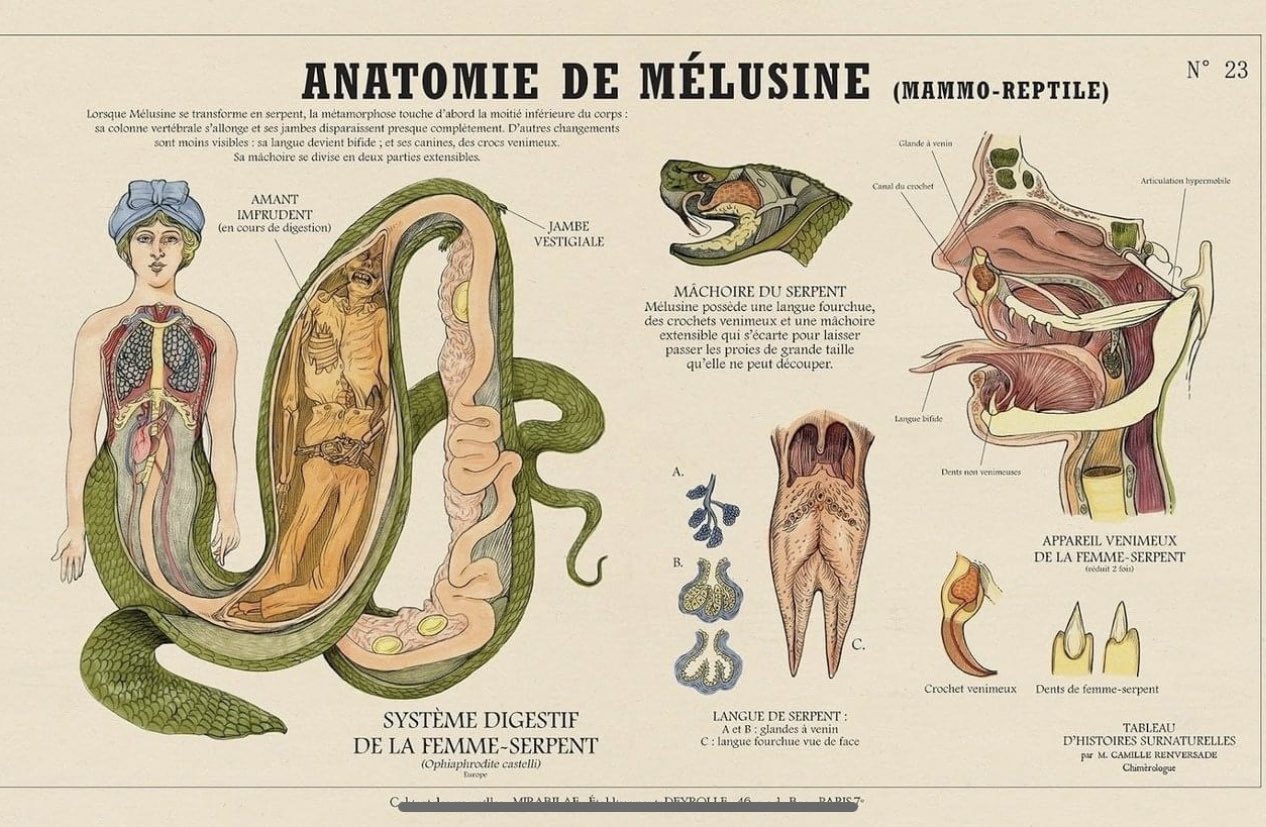
Do you know what the juicy interior of a Kraken looks like? Have you ever seen the inside of a unicorn’s magical horn? What about the biochemical transformation of a man into a a werewolf? Here are some marvellous anatomical figures from French Chimerologist Camille Renversade who in 2014 combined zoology charts, anatomy boards andContinue reading “The Anatomy of Fantastical Creatures”
Tech: A quaint visual voyage through the internet in 1996

Found in the David Rumsey Map Collection online, this poster entitled Ínternet Road Map from the magazine PC Computing dates from the quaint year of internet history, 1996. Back when I was a teen and when ‘surfing the web’ was something only geeks and introverts did, and therefore which I did with fervour using someContinue reading “Tech: A quaint visual voyage through the internet in 1996”
An interesting holistic model for health according to the eight tentacles of the Octopus, Te Wheke in Māori culture

The Maori (the indigenous people of New Zealand) which includes myself, have a very different way of defining health outcomes compared to western medicine. Te Wheke (the octopus) is often used as a symbol to define integrative and holistic health. This holistic approach to health encompasses ten elements in Maori life. Funnily enough this holisticContinue reading “An interesting holistic model for health according to the eight tentacles of the Octopus, Te Wheke in Māori culture”
A pictorial history of electronic music mapped to the circuitboard of a theremin

This pictorial history of electronic music adapted and mapped on the circuit board of a theremin was created by the quirky folk at Dorothy. The theremin is thought to be one of the world’s first electronic musical instruments along with the Moog synthesizer. Our Electric Love Blueprint celebrates over 200 inventors, innovators, artists, composers and musiciansContinue reading “A pictorial history of electronic music mapped to the circuitboard of a theremin”
Interactive History Like You’ve Never Seen It Before

Histography is a visually stunning interactive online timeline that spans across 14 billion years of history, from the Big Bang to 2015. Taking data from Wikipedia, the site updates automatically and orders events using an algorithm. It’s like Wikipedia just with more engaging and interactive audiovisual specs and beautiful typography. The interface allows for usersContinue reading “Interactive History Like You’ve Never Seen It Before”
A Personalised Interactive Infographic About Your Life from the BBC
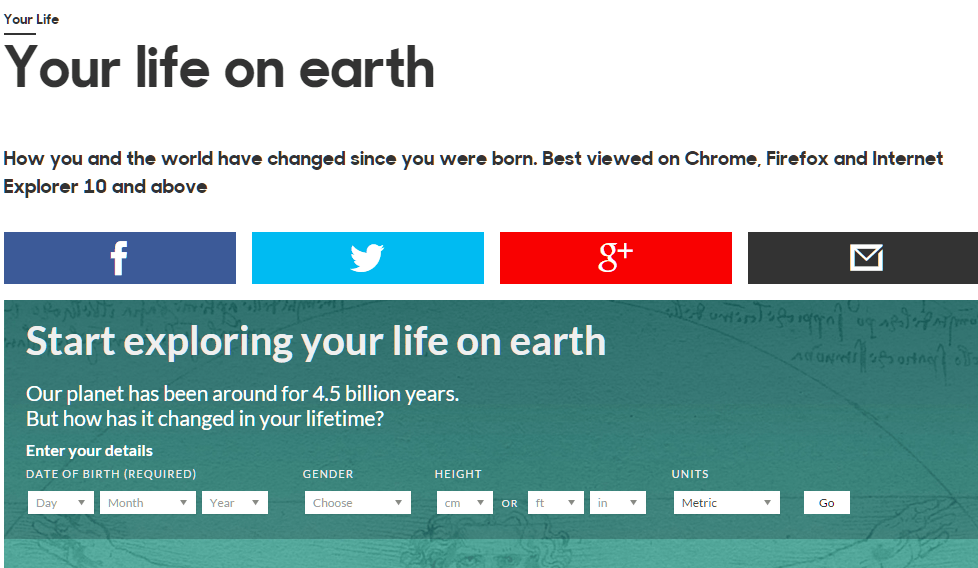
It’s no secret that I adore infographics. Even better are infographics or interactive media that has a personal angle. This enables the user to better relate to and absorb the information in a meaningful way. This interactive infographic from the BBC certainly does add a new dimension to the data. It’s a clever combination ofContinue reading “A Personalised Interactive Infographic About Your Life from the BBC”

You must be logged in to post a comment.